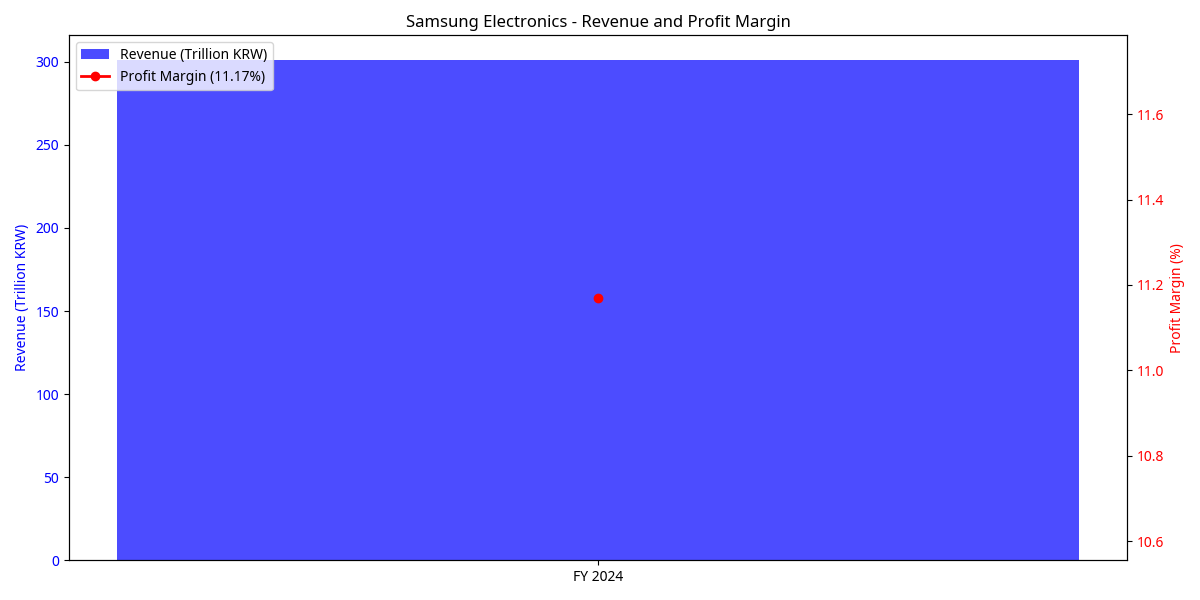
Revenue Growth
Samsung's revenue growth remains positive despite challenging market conditions, indicating resilience in its diversified business model. However, Q1 2025 has shown signs of weakness with a 21% YoY drop in operating profit.
Profitability
| Metric | Value | Assessment |
|---|---|---|
| Profit Margin | 11.17% | Strong |
| Operating Margin | 8.56% | Good |
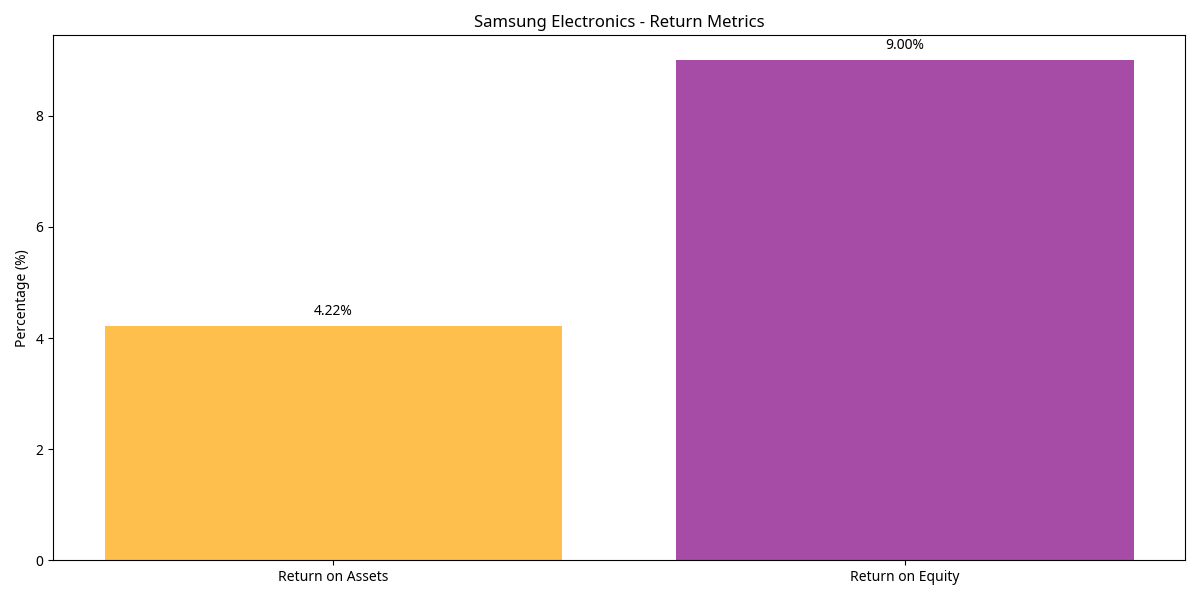
| Return on Assets (ROA) | 4.22% | Moderate |
| Return on Equity (ROE) | 9.00% | Good |
Samsung maintains solid profitability metrics, though they have declined from historical peaks due to pressure on memory chip prices and increased competition.
Debt Obligations
Samsung's debt levels are manageable, with a low debt-to-equity ratio and strong current ratio indicating solid short-term liquidity. The company's financial position remains strong enough to weather temporary downturns.
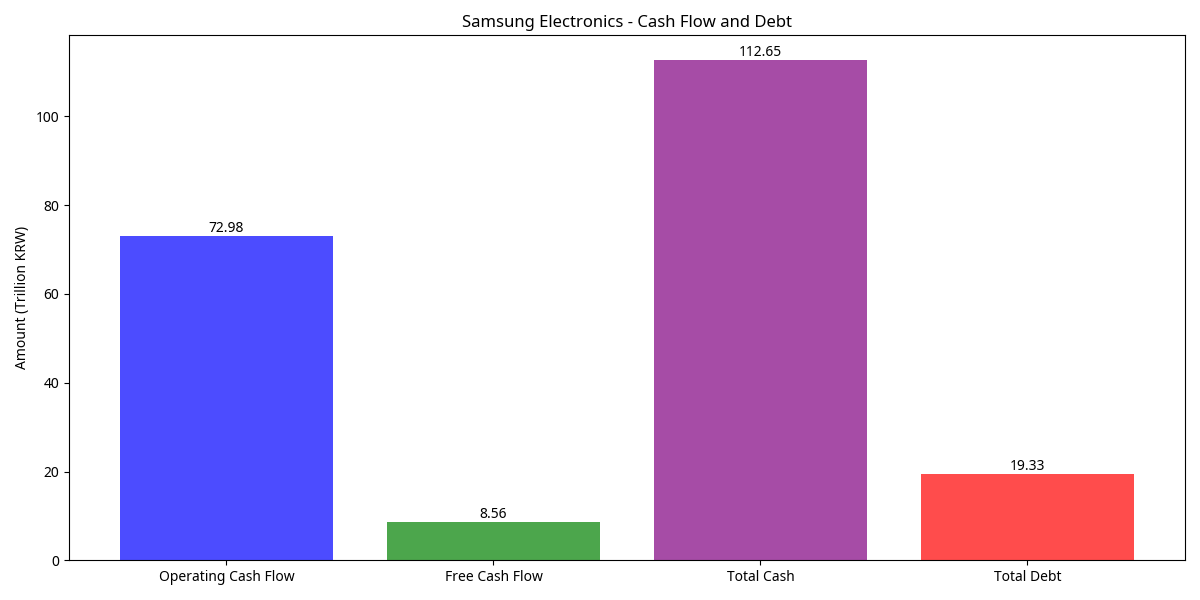
Cash Flow
Samsung generates robust cash flows, providing flexibility for investments, dividends, and potential M&A activity. The substantial cash reserves provide a significant buffer against market volatility.